Top 7 Statsig alternatives for feature flags

The best Statsig alternative for feature flags is the platform that keeps application behavior predictable during ordinary releases, partial outages, emergency rollbacks, and future migrations. A longer product checklist does not make a flag system safer.
Statsig combines feature gates, dynamic configuration, experiments, product analytics, and session replay. That breadth is useful when one managed event platform fits the organization. Teams still look elsewhere when they want a self-hosted control plane, a more specialized feature-management workflow, clearer infrastructure economics, deeper enterprise release governance, or experimentation that queries metrics from their existing warehouse.
The company context also matters in 2026. OpenAI acquired Statsig in 2025, and Amplitude announced that it would develop the Statsig platform across cloud and warehouse deployments while supporting existing customers. That does not make the platform unavailable. It does mean buyers should evaluate the current product and the integration roadmap, especially for a capability as operationally sensitive as feature flags.
This guide focuses narrowly on feature management. It compares runtime evaluation, configuration delivery, targeting, rollouts, flag lifecycle, governance, deployment control, pricing meters, and migration behavior. Experimentation and analytics appear only where they materially improve or complicate the flag workflow.
Statsig feature flag alternatives at a glance
| Alternative | Best for | Evaluation and deployment | Main watchout |
|---|---|---|---|
| GrowthBook | Flags connected to trustworthy experiments | Local SDK evaluation; cloud or self-hosted control plane | Advanced governance varies by plan |
| LaunchDarkly | Enterprise release governance | Managed control plane with local SDK evaluation and relay options | Usage model can be complex across application topologies |
| Unleash | Self-hosted feature-management specialists | Local evaluation from synchronized configuration; cloud or self-hosted | Experiment analysis usually needs another system |
| Flagsmith | Remote config and flexible hosting | Client/server SDKs; cloud, private cloud, or self-hosted | Paid governance boundary needs close review |
| ConfigCat | A focused managed flag service | CDN-delivered configuration with local cached evaluation | Not an integrated experimentation platform |
| DevCycle | Developer workflow and OpenFeature adoption | Local or cloud bucketing with managed control plane | Product is transitioning under Dynatrace ownership |
| PostHog | Product-stack consolidation | Cloud flags tied to analytics, replay, and experiments | Many usage meters; self-hosting is officially unsupported |
These products are not interchangeable. GrowthBook and PostHog connect flags to product evidence. LaunchDarkly optimizes for controlled delivery at enterprise scale. Unleash and Flagsmith offer open-source control planes. ConfigCat stays intentionally focused. DevCycle leans into developer tooling and OpenFeature. The right shortlist starts with the failure mode and operating model, not the number of adjacent products.
What to compare before replacing Statsig
Compare the runtime path against GrowthBook's feature flag architecture, then include cloud and self-hosted deployment choices in the engineering scorecard.
Runtime evaluation and cold starts
Most mature flag SDKs cache configuration and evaluate locally, but the details determine reliability. Ask what happens when a process starts without a valid configuration, how long the last known configuration survives, whether a server SDK blocks readiness, and which fallback value is returned after an error.
Test both steady-state and startup failures. Disconnect the control plane after a payload loads, then launch a fresh instance with no network. Corrupt the cache. Delay initialization. Send missing, null, and malformed attributes. A platform that works during a demo may still produce inconsistent behavior across a rolling deploy.
The canonical Feature Toggles pattern separates release, experiment, operational, permission, and other toggle categories because they have different lifetimes and risk. An operational kill switch may need a conservative default and rapid propagation. A UI experiment may tolerate a cached assignment. Treating every flag as the same boolean loses this distinction.
Targeting and context semantics
Statsig feature gates and dynamic configs can evaluate properties, cohorts, user identities, percentages, and rules. A replacement needs equivalent outcomes, not merely similar labels. Compare:
- Boolean, string, number, and JSON values.
- User, account, device, and anonymous identifiers.
- Segments, prerequisites, and reusable audiences.
- Missing attributes and type coercion.
- Semantic-version, date, numeric, and regex operators.
- Percentage rollouts and sticky assignments.
- Client-safe versus server-only rules.
OpenFeature provides a vendor-neutral evaluation API and common concepts such as evaluation context, providers, hooks, and events. It can reduce application-code coupling, but it cannot make two providers' rule engines or bucketing algorithms identical. Configuration portability and code portability are separate problems.
Rollout safety and propagation
Measure the interval from an approved change to consistent evaluation across regions, services, browsers, and mobile clients. Streaming can propagate quickly but must recover from dropped connections. Polling is simpler but creates a maximum delay. A relay or proxy can reduce outbound connections while becoming another production dependency.
Use the same discipline as a canary release. Define the first cohort, observation window, stop conditions, rollback owner, and evidence required before increasing traffic. The Google SRE guidance on canarying releases is useful even when the traffic split is controlled by a flag rather than a deployment system.
Governance and flag debt
Feature flags modify production behavior, so access control, approvals, audit history, environment boundaries, and credential scopes matter. Confirm that client-side keys cannot retrieve server-only configuration and that service credentials cannot administer flags.
Flag lifecycle is a separate requirement. A stale marker does not safely remove code. Every temporary flag should have an owner, expected removal condition, creation date, and cleanup issue. Code references, CLI scans, and notifications help locate debt, but an engineer still has to decide which branch becomes permanent and remove the alternative safely.
Measurement without confusing flags and experiments
A 50/50 rollout is not automatically an A/B test. Causal measurement requires stable random assignment, an exposure event at the moment treatment can affect behavior, metrics defined at the right unit, quality checks such as sample ratio mismatch, and a statistical decision rule.
If Statsig currently supplies both flag assignment and analysis, decide whether the replacement should preserve that combined workflow or intentionally separate the systems. GrowthBook keeps the connection while querying governed warehouse metrics. LaunchDarkly, DevCycle, and PostHog provide varying degrees of integrated evidence. Unleash, Flagsmith, and ConfigCat are often paired with another analytics or experimentation layer.
Ownership and pricing meters
Model cost from real topology. A platform may meter client monthly active users, server connections, configuration downloads, evaluation requests, events, seats, or several at once. A backend with hundreds of short-lived workers behaves differently from a mobile application with millions of devices.
Also price the roadmap. Statsig's platform is now being developed through Amplitude's strategic arrangement, while DevCycle says it is part of Dynatrace. Acquisitions do not invalidate either tool, but they increase the importance of export coverage, contract terms, provider abstractions, and a repeatable migration harness.
1. GrowthBook: Best overall Statsig alternative for feature flags
Best for
GrowthBook is best for product, engineering, and data teams that want feature flags tied to rigorous experimentation, open-source inspectability, warehouse-native metrics, and a choice between managed cloud and self-hosting.
Key strengths
GrowthBook feature flags support targeting rules, percentage rollouts, remote configuration, prerequisites, environments, webhooks, APIs, and SDKs across client, server, mobile, and edge stacks. SDKs evaluate locally after loading configuration, so application decisions do not require a synchronous request to the control plane.
The main difference from a flag-only service is measurement. A rule can become an experiment, and the analysis can use governed metrics from the organization's existing warehouse. That avoids duplicating a second product-event model just to evaluate releases. Teams can inspect queries, reconcile results with source data, and use Bayesian or frequentist analysis, sequential testing, CUPED, guardrails, dimensions, holdouts, and sample ratio mismatch checks as their plan supports.
GrowthBook's MIT-licensed core repository exposes evaluation and statistical logic, while named enterprise directories use a separate license. The deployment model is useful when infrastructure control or a credible exit path is part of the procurement decision.
For migrations, GrowthBook's product includes importers for Statsig and other platforms. An importer reduces manual entry, but the responsible workflow still compares rules, prerequisites, JSON values, and assignment behavior before a flag controls production.
Watchouts
Warehouse-native analysis is most valuable when teams have reliable source data and clear metric ownership. Self-hosting also moves upgrades, backups, observability, incident response, and security to the buyer. Enterprise controls such as custom environments, approval workflows, advanced roles, and SCIM sit in higher packaging tiers, so map governance requirements before choosing a plan.
Pricing and implementation notes
The current Starter cloud plan is free for up to three users and one project with unlimited feature flags, experiments, and traffic. Pro is published at $40 per seat per month, and the open-source self-hosted edition is free. Cloud CDN allowances and advanced capabilities vary by plan, so model configuration delivery as well as seats.
Start the proof of concept with one server flag, one client flag, one typed remote configuration, one prerequisite, and one account-level experiment. GrowthBook's warehouse-native model is especially relevant when Statsig's event pipeline is the part you want to replace.
2. LaunchDarkly: Best for enterprise release governance
Best for
LaunchDarkly is best for large engineering organizations that prioritize release workflows, role design, broad SDK coverage, environment control, observability, and mature operational support.
Key strengths
LaunchDarkly feature management covers boolean and multivariate flags, user and account targeting, segments, percentage rollouts, projects, environments, and a broad SDK ecosystem. Enterprise packaging adds custom roles and teams, approval requests, scheduling, multi-step release workflows, SCIM, and release automation.
This depth matters when many application teams share the platform. Central governance can standardize flag naming, environment promotion, approvals, emergency changes, and access boundaries. Relay components and local SDK evaluation support architectures that need controlled configuration distribution without synchronous remote evaluation on every request.
The trade is focus. LaunchDarkly is a feature-delivery specialist first. It now includes experimentation and observability capabilities, but a team leaving Statsig's integrated analytics workflow should verify which evidence, retention, and automation features are included in its chosen package.
Watchouts
Current pricing uses service connections and client-side monthly active users, with enterprise features and the Guardian release-safety layer packaged separately. That can be predictable for a stable topology and harder to forecast across serverless jobs, many environments, or large consumer audiences. Export rule semantics and build a provider-neutral application layer where practical; the platform remains proprietary.
Pricing and implementation notes
The Developer tier is free with unlimited seats and flags, five service connections, 1,000 client-side MAU, and one project with three environments. Foundation publishes $10 per additional service connection per month and $8.33 per 1,000 client-side MAU when billed yearly. Enterprise is custom.
Run a topology-based estimate rather than multiplying employees. Count every server SDK/environment connection, client identity, relay, and required environment. Include the paid governance and rollback features the organization actually needs.
Compare GrowthBook and Statsig
See how open-source deployment, warehouse-native metrics, feature flag pricing, and experimentation workflows differ before you migrate.
View the platform comparison
3. Unleash: Best self-hosted flag specialist
Best for
Unleash fits platform teams that want an open-source feature-management control plane, local SDK evaluation, flexible deployment, and a focused alternative to Statsig's broader product suite.
Key strengths
Unleash supports activation strategies, constraints, variants, segments, projects, environments, tags, lifecycle tracking, and more than two dozen SDKs. Clients synchronize configuration and evaluate locally. Custom activation strategies let a platform team encode organization-specific targeting behavior when the standard operators are insufficient.
The current Unleash source license is AGPL-3.0, which is a material procurement detail for teams relying on older descriptions of the project as Apache-licensed. The open-source edition provides a substantial control plane; paid cloud, self-hosted, and hybrid offerings add enterprise collaboration, safeguards, support, and service commitments.
Unleash is attractive when feature management itself is the product requirement. Its experimentation surface includes variants and impact concepts, but teams that need Statsig-like analysis should evaluate an additional statistics and metric-governance layer.
Watchouts
Open source does not mean every enterprise workflow is included without charge. Compare approvals, advanced roles, audit retention, safeguards, support, and environments across editions. AGPL obligations deserve legal review, especially if the organization modifies the server or exposes a modified network service.
Pricing and implementation notes
The published enterprise pay-as-you-go offer is $75 per seat per month. Cloud includes 53 million API requests per month with overages, while the self-hosted pay-as-you-go option has a five-seat minimum. The open-source project has no subscription fee but requires internal infrastructure and on-call ownership.
Test configuration propagation across multiple services, stale-cache behavior, custom strategies, upgrades, and database restore. If experiment analysis remains outside Unleash, test the exposure handoff at the same time.
4. Flagsmith: Best for remote configuration and hosting choice
Best for
Flagsmith is a strong choice for teams that want feature flags and remote configuration across cloud, private cloud, self-hosted, or air-gapped environments.
Key strengths
Flagsmith combines boolean flags with typed configuration values, identities, traits, segments, multivariate options, environments, and client/server SDKs. The Flagsmith repository is primarily BSD-3-Clause licensed, which gives teams an inspectable core and a practical self-hosting path.
Remote configuration is the differentiator for teams controlling limits, endpoints, UI copy, model selection, or operational parameters. Multiple hosting arrangements can also satisfy network and residency constraints that a managed-only Statsig deployment cannot.
The control plane includes APIs and webhooks, while paid plans add schedules, integrations, roles, permissions, change requests, audit history, SSO, and higher support levels. This makes the open-core boundary understandable, but it must be mapped against the exact governance design.
Watchouts
A/B and multivariate allocation does not by itself provide Statsig's experiment statistics. Plan an exposure and analysis integration if product decisions depend on causal evidence. Some high-value governance capabilities are paid, and cloud usage is request-metered.
Pricing and implementation notes
The cloud Free plan currently includes 50,000 requests per month, one team member, and unlimited flags, environments, identities, and segments under fair-use terms. Start-Up is published at $45 per month for one million requests and three members; Scale-Up is $300 per month for five million or more requests and adds governance. Enterprise supports tailored hosting.
Test identity traits, JSON values, client-safe configuration, offline behavior, and export/import. For self-hosting, include database, cache, upgrade, backup, and support costs in the comparison.
5. ConfigCat: Best focused managed service
Best for
ConfigCat fits teams that want a straightforward managed feature-flag and remote-configuration service without adopting a broader analytics or experimentation suite.
Key strengths
ConfigCat distributes configuration JSON through a CDN, and SDKs cache that configuration for local evaluation. The architecture makes the billable unit explicit: configuration downloads rather than every flag read. The service supports boolean and typed settings, targeting rules, percentage options, segments, environments, products, a management API, webhooks, and SDKs for major server, client, mobile, and game-development stacks.
The focused product can reduce administrative overhead for a team that does not want Statsig's analytics, replay, or metrics layer. Its public SDK repositories also let engineers inspect client behavior even though the managed control plane is not generally open source.
ConfigCat includes flag-debt tools such as a CLI for discovering code usage and a stale-flag report. Those signals are useful inputs to cleanup, though code removal still requires engineering review and tests.
Watchouts
The service is not a full experimentation replacement. Teams must connect exposures to an analytics or statistics system if flags inform causal decisions. The on-premise Dedicated option is substantially more expensive than ordinary cloud plans, and software escrow is not the same as routine self-hosting.
Pricing and implementation notes
Forever Free currently includes 10 flags, two environments, two products, five million configuration downloads per month, 20 GB of traffic, and unlimited seats. Paid monthly list prices begin at $110 for Pro, $325 for Smart, $900 for Enterprise, and $4,500 for Dedicated.
Estimate downloads from polling frequency and application instances, not user clicks. Test startup with an empty cache, update latency under each polling mode, mobile offline behavior, and the operational effect of reaching plan limits.
6. DevCycle: Best for OpenFeature-oriented developer workflows
Best for
DevCycle fits engineering teams that want OpenFeature support, typed variables, schemas, debugging tools, APIs, CLI workflows, and code-oriented flag management.
Key strengths
DevCycle supports local and cloud bucketing, realtime updates, targeting, segments, percentage rollouts, multistep rollouts, reusable audiences, flag and property schemas, code references, a CLI, REST API, editor integration, webhooks, and an MCP server. The product states that OpenFeature is supported across all SDKs, which can help a team establish a more portable application interface.
Its open-source Bucketing API repository and public SDK ecosystem provide useful implementation visibility, while the managed platform supplies the control plane. Schema support is particularly helpful when dynamic configuration carries structured data rather than a boolean.
DevCycle says it is now part of Dynatrace after a platform asset purchase. The ownership change may improve its observability integration over time, but buyers should ask which APIs, SDKs, pricing meters, and roadmap commitments will remain stable.
Watchouts
OpenFeature reduces source-code coupling, not configuration migration work. DevCycle's own rule model, audience storage, and rollout semantics still need parity testing. Advanced roles, approvals, SSO, SCIM, and SLA commitments sit in Enterprise. Business pricing combines a base plan with MAU, configuration-request, and event allowances.
Pricing and implementation notes
The Free plan includes unlimited seats, flags, projects, and environments, plus 1,000 client-side MAU, 10,000 cloud-config requests, 100,000 server-config requests, and 5,000 events monthly. Business is shown at $500 per month when billed annually with larger included volumes; Enterprise is custom.
Build a cost model for all four meters. In the proof of concept, compare local and cloud bucketing, schema validation, provider behavior, realtime updates, and the fallback returned when the edge path is unavailable.
7. PostHog: Best for consolidating product tools
Best for
PostHog fits product engineering teams that want feature flags, product analytics, session replay, experiments, surveys, error tracking, and data tooling in one cloud product.
Key strengths
PostHog feature flags support person and group targeting, cohorts, percentage rollouts, dependencies, phased releases, canaries, payloads, remote configuration, API management, and server-side local evaluation. Because the same platform stores product events and replay data, teams can inspect what exposed users did without building several integrations.
The PostHog repository places code outside its enterprise directory under the MIT Expat license. That open-source core improves inspectability, but the current self-hosted deployment is officially unsupported, has no paid support or guarantees, and limits paid features to Cloud. Treat the cloud product as the realistic Statsig alternative unless the organization deliberately accepts the hobby deployment's operational risk.
PostHog's breadth can reduce vendor count. It can also make feature-management cost and governance harder to isolate because flags share identities, events, properties, experiments, and other product surfaces.
Watchouts
The suite is cloud-first and usage based. Product analytics events, recordings, exceptions, data pipelines, and other capabilities have separate meters. Advanced experimentation teams should validate metric definitions, assignment stability, quality checks, and statistical outputs rather than assuming integration means rigor.
Pricing and implementation notes
The current free allowance includes one million feature-flag requests per month, and experiments are billed with feature flags. Paid flag traffic starts at $0.0001 per request for the next million and falls by volume. The broader free plan includes one project, one-year retention, and unlimited members.
Estimate the complete PostHog bill, not the flag line alone. Test identity merges, group targeting, local evaluation, replay access boundaries, experiment exposure timing, and billing-limit behavior.
Architecture decisions that change the shortlist
Feature-flag products often look similar in screenshots because every dashboard can display a key, variations, rules, and a percentage slider. The meaningful differences appear in the runtime data path. Decide which architecture your applications can tolerate before ranking collaboration features.
Local evaluation with distributed configuration
Local evaluation places the rule engine inside each SDK. The control plane publishes a versioned configuration payload, and applications calculate the variation from that payload and the current context. GrowthBook, LaunchDarkly, Unleash, ConfigCat, and several other finalists support this pattern in important SDKs.
The benefit is that an ordinary evaluation does not wait on a vendor round trip. After a valid configuration is cached, an application can often continue through a temporary control-plane outage. This is especially useful for high-throughput APIs, mobile clients, edge workloads, and services where a few milliseconds of extra dependency latency would compound.
The cost is distributed state. A production fleet may contain several configuration versions at once during propagation. Long-lived mobile clients can remain stale, short-lived jobs can start before a payload arrives, and client-side applications must not receive confidential rules. Ask whether the provider produces separate client and server payloads, how SDKs authenticate downloads, how configuration versions appear in logs, and whether a durable cache survives process restarts.
Create an explicit initialization policy for each flag class. A cosmetic experiment can return control while the SDK loads and accept a default. A payment-path permission may need to block readiness or read an internal source of truth. “The SDK has a fallback” is not a sufficient safety design unless the team has chosen that value for the specific failure.
Remote evaluation and edge bucketing
Remote evaluation sends a context to a service and receives a variation. The pattern keeps sensitive targeting logic off clients and can centralize large segments or fast-changing attributes. Cloud bucketing and edge services can also make identity storage convenient when an application does not want to attach every property to every call.
The evaluator becomes a runtime dependency, even when it is deployed near users. Measure p50, p95, and p99 latency, timeout behavior, connection pooling, retry amplification, regional failover, and the response to invalid context. Confirm whether the SDK has a bounded cache and whether a cached value is scoped to the full context rather than only a user ID.
Privacy review is part of the architecture. A remote evaluator may receive account IDs, plan tiers, geography, device data, or internal risk properties. Minimize the context, classify every field, and inspect logging and tracing. A feature flag is not permission to copy an entire user profile into another service.
Relays, proxies, and private network boundaries
A relay or proxy can synchronize configuration once and serve many applications inside a network. This reduces outbound connections, supports private endpoints, and can isolate services from a public control plane. It can also become a shared point of failure.
Treat the relay like production infrastructure: run multiple instances, expose readiness separately from liveness, monitor the age of its configuration, test certificate and token rotation, and document compatibility with SDK and control-plane versions. A proxy that returns HTTP 200 while serving a week-old payload is available but unsafe.
For self-hosted products, extend the same analysis to the database, cache, stream broker, edge component, and dashboard. Decide which parts are required for evaluation and which are only required to make changes. A resilient design may allow applications to evaluate from cached configuration while the administrative UI is unavailable.
Flag values are not an authorization system
Product teams sometimes use a flag to represent plan entitlements, regulatory access, or permissions because targeting rules are convenient. This creates a dangerous ambiguity. A flag can control presentation or progressive exposure, but the server-side authorization decision must remain fail-closed and auditable.
The OWASP authorization guidance recommends validating permissions on every request and denying by default. If a flag controls a paid capability, keep billing or entitlement data in the authoritative backend, evaluate it server-side, and let the flag govern rollout only after authorization succeeds. Never rely on a client-visible flag value to protect data or operations.
This distinction affects vendor selection. A platform with account contexts and JSON values may simplify UI consistency, but it does not replace a policy engine or entitlement service. Include an attempted bypass in the proof of concept so the architecture—not just the dashboard—proves the boundary.
Stable assignment needs an explicit unit
Every percentage rollout needs a stable key. Consumer products often assign by user; B2B SaaS releases may need account-level assignment so colleagues see the same behavior; anonymous funnels may need a device or cookie that later reconciles with an identified user.
Document the randomization unit, analysis unit, and persistence strategy for every experiment flag. If they differ, the statistics must account for clustering. If anonymous and authenticated identities merge, decide whether treatment follows the original anonymous assignment or is recalculated. If an account changes plan, decide whether it can cross into another variation mid-experiment.
During migration, two providers can both advertise deterministic rollouts and still assign different cohorts because their hashes, salts, namespaces, or context serialization differ. Preserve an exported assignment when continuity matters, or begin a new exposure period and analyze it separately. This is the central reason a dual-evaluation harness should report more than an aggregate 50/50 split.
How to choose among the seven alternatives
Use the dominant constraint to cut the shortlist:
| Dominant requirement | Start with | Why |
|---|---|---|
| Flags plus warehouse-native experiments | GrowthBook | Assignment and analysis share governed metrics without a second event model |
| Mature enterprise release governance | LaunchDarkly | Deep approvals, roles, scheduling, automation, and SDK ecosystem |
| Open-source flag control plane | Unleash | Focused self-hosted feature management with local evaluation |
| Remote config and deployment flexibility | Flagsmith | Cloud, private, self-hosted, and air-gapped choices |
| Small, focused managed flag service | ConfigCat | Clear CDN configuration model and minimal adjacent product surface |
| OpenFeature and developer tooling | DevCycle | Provider support, schemas, CLI, code references, and debugging |
| Product-suite consolidation | PostHog | Flags connect directly to analytics, replay, and experiments |
Do not score every feature equally. A team that must self-host should eliminate managed-only finalists early. A regulated company should test audit export and credential boundaries before UI convenience. A high-volume consumer app should cost client identities and configuration traffic before comparing seats. An experimentation-heavy team should validate exposure and statistics before rollout dashboards.
A safe migration from Statsig feature gates
Inventory the current estate
Export gates, dynamic configs, experiments, layers, segments, environments, owners, tags, and change history. Scan every repository for SDK initialization, gate checks, config reads, fallback values, event hooks, overrides, and test fixtures. Classify each item as release, operational, experiment, permission, entitlement, configuration, or stale.
Remove confirmed stale gates before migration. Recreating debt consumes parity work while increasing the number of production switches no one understands.
Build a semantic mapping
For each active gate, document the current context fields, operators, missing-value behavior, bucket identifier, percentage allocation, prerequisites, JSON schema, client visibility, and fallback. Then map the candidate's behavior explicitly.
Pay particular attention to account-level SaaS rollouts. If Statsig currently buckets on user ID but the business decision belongs to an organization, migration is the right moment to correct the unit—but not during an active experiment. Make an intentional cutover with documented exposure effects.
Compare evaluations before controlling traffic
Create a fixture containing representative and edge-case contexts. Evaluate Statsig and the candidate side by side, then produce a diff. Include null attributes, unknown users, semantic versions, segment membership, prerequisites, each variation type, and thousands of synthetic identifiers for percentage rollouts.
Shadow evaluation in production can reveal unmodeled contexts while Statsig remains authoritative. Do not send additional personal attributes to a candidate without privacy review, and do not log sensitive configuration in the parity report.
Migrate in risk order
Move internal and dormant flags first, then low-risk configuration, then ordinary releases. Migrate operational kill switches, permissions, billing controls, and active experiments last. Freeze edits during each cutover or create a process that mirrors approved changes into both systems.
Keep the prior SDK and configuration available until the candidate meets explicit thresholds for parity, update latency, error rate, and operator confidence. Rollback should be a rehearsed action, not a document written after an incident.
Proof-of-concept scorecard
Give each finalist the same production-like workload:
- Three real SDK languages across client and server applications.
- Twenty-five flags spanning boolean, string, number, and JSON values.
- User and account contexts, reusable segments, and prerequisites.
- A 1%, 10%, 50%, and 100% progressive rollout.
- One operational kill switch and one experiment.
- Three environments and at least two projects.
- Cold start without the control plane and network loss after initialization.
- A dropped stream or delayed poll, followed by rollback.
- Credential rotation, approval, audit export, and stale-flag cleanup.
- A twelve-month cost model using expected and stressed topology.
Score runtime correctness before dashboard usability. Require the future internal operator to diagnose a mismatched evaluation, restore configuration, rotate a credential, and explain the billing calculation. If the platform is self-hosted, include an upgrade and backup restore. If it is managed, include a region or control-plane outage exercise using the vendor's documented SDK behavior.
Final recommendation
GrowthBook is the best overall Statsig alternative for feature flags when the team wants local evaluation, open-source control, self-hosting, predictable pricing, and experiments grounded in existing warehouse metrics. LaunchDarkly is the stronger first choice when enterprise release governance outweighs deployment control and cost simplicity. Unleash and Flagsmith are the best self-hosted specialists; ConfigCat is the cleanest focused managed service; DevCycle is compelling for OpenFeature-oriented engineering workflows; and PostHog fits teams intentionally consolidating product tooling.
The decision should survive more than a feature comparison. Test the candidate while the control plane is unavailable, prove assignment behavior across a migration, cost the actual application topology, and name the person who owns flag cleanup. Those exercises reveal more than a polished demo.
Start with GrowthBook for free using one representative Statsig gate. If you need to map a larger estate, book a GrowthBook demo and bring the SDK, governance, and warehouse requirements to the conversation.
Migrate flags with evidence
Try GrowthBook with one real gate, compare evaluations, and connect the rollout to metrics your team already trusts.
Start your GrowthBook proof of conceptRelated Articles
The same test statistic can support different conclusions when its degrees of freedom change.
You open an experiment report and see a t-statistic, a p-value, and a number labeled df. It might be 49, 118, or 19.48. That last value is not a typo. Degrees of freedom do not always equal the number of users minus 1, and they do not always come in whole numbers.
Degrees of freedom describe the independent variation available to a particular calculation or index the reference distribution used for inference. In familiar variance calculations, constraints explain them directly. In methods such as Welch's t-test, an approximation produces an effective value instead.
For experimentation, the useful question is specific: which calculation produced this df, and does that calculation match the data? Understanding that connection helps you spot wrong denominators, mismatched tests, and confidence intervals built from the wrong reference curve.
Start with the constraint behind n minus 1
Three observations, two freely varying deviations
Take a hypothetical sample of 3 measurements: 2, 4, and 6. Their mean is 4. Subtract that sample mean from each measurement and the deviations are -2, 0, and 2.
Those deviations sum to zero. They must: the mean was calculated from the same values. Once you know the mean and the first 2 deviations, the last deviation is determined. If the first 2 sum to -2, the last must be 2.
This is the intuition behind n - 1 degrees of freedom for the usual sample variance. There are n deviations but 1 independent linear constraint. Their possible patterns occupy n - 1 independent directions. You have not discarded a person or stopped using a measurement. All 3 values still contribute to the variance calculation.
You can see the arithmetic in this sample. Squaring the deviations gives 4, 0, and 4, for a total of 8. Divide by n - 1, which is 2, and the sample variance is 4. The sample standard deviation is its square root, or 2.
Why estimating the mean changes the denominator
The sample mean is fitted to the observed data. Deviations from that fitted mean tend to be smaller than deviations from the unknown population mean. For independent observations from the same distribution with finite variance, dividing their squared sum by n - 1 corrects the downward bias in the variance estimate.
The usual sample variance and one-sample t calculation therefore share the n - 1 quantity. This does not make the sample standard deviation itself exactly unbiased; taking the square root is a separate operation.
If your dataset is the entire finite population you want to describe, averaging squared deviations over n is a legitimate descriptive calculation. The denominator depends on the target. Estimating variation in a larger population is different from describing the values you already have.
Keep the intuition within its scope
“Independent observations minus fitted parameters” is useful for ordinary linear models, but it is not a universal df calculator. You must know what statistic is being calculated and what constraints or approximations apply.
Even a software parameter called ddof needs interpretation. The degrees-of-freedom adjustment in a standard-error calculation controls a variance denominator. It is not an instruction to use the same number as the reference df for every later test. A variance correction, a model's residual df, and a test's reference df are related concepts, not interchangeable labels.
See how df changes a statistical threshold
A t-statistic needs a reference curve
A t-statistic expresses an estimated difference relative to its estimated standard error. Its interpretation depends on the reference t distribution, whose shape is indexed by df. Low-df t distributions have heavier tails, reflecting uncertainty in the variance estimate under the model.
For a prespecified two-sided test at a 5% significance level, compare the absolute t-statistic with the appropriate 97.5th percentile. The t critical-value table gives approximately 2.776 at 4 df and 1.984 at 100 df.
Suppose two separate hypothetical analyses each produce t = 2.1. At 4 df, that value does not cross the 5% threshold. At 100 df, it does. The difference is not a judgment about the product feature. It follows from the reference distributions used to assess sampling uncertainty.
The reference distribution must itself be appropriate. Exact one-sample t inference assumes independent, normally distributed observations; large-sample approximations can cover broader settings. A small df does not automatically make a test invalid, but it gives you little protection against a poor distributional approximation. For highly skewed revenue measured on a handful of users, looking up the correct df is only one part of assessing the method.
Degrees of freedom are not the effect size
Larger df do not mean a bigger lift or a better variant. A tiny effect in a large sample can have high df. A large but imprecise effect in a small sample can have low df. You still need the effect's units, its interval, and a business threshold for deciding whether it matters.
Nor should you interpret df as statistical power. Power depends on the effect size you want to detect, variability, allocation, sample size, significance rule, and design. Use power analysis before launching an experiment to plan sensitivity. Reading a large df after the experiment does not replace that work.
Make small effects easier to detect
Degrees of freedom are only one part of uncertainty. Explore metric design and variance reduction techniques that can improve an experiment's sensitivity.
Explore Variance Reduction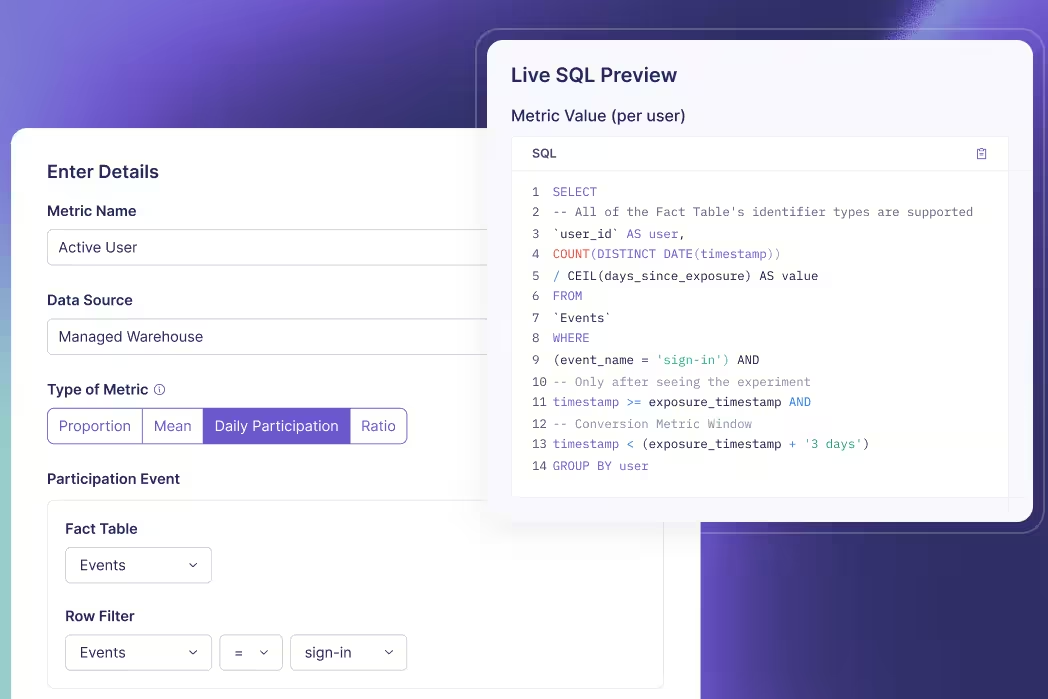
Choose the formula for the method you actually use
One sample, pairs, and pooled groups
For a one-sample t-test, n independent observations give n - 1 df. For a paired t-test, calculate a difference within each pair, then analyze those independent differences. With 30 complete pairs, the usual paired test has 29 df, not 59.
For the pooled two-sample t-test, the common variance estimate combines the two groups' variance information. Its df are nA + nB - 2. The test assumes equal population variances as well as independent groups. You should not select that formula merely because you have an A/B experiment.
| Calculation | Usual degrees of freedom | What must be counted correctly |
|---|---|---|
| One-sample t-test | n - 1 | Independent observations in the sample |
| Paired t-test | Number of complete pairs - 1 | Independent pairs, not both measurements separately |
| Pooled two-sample t-test | nA + nB - 2 | Independent group sizes and the common-variance assumption |
| Welch's two-sample t-test | Welch-Satterthwaite approximation | Each group's size and variance |
| Ordinary least-squares residual variance | n - rank(X) | Usable rows and independent columns of the design matrix |
| Chi-square independence test | (Rows - 1) × (Columns - 1) | The contingency table's category structure |
These are method-specific formulas, not options to try until a result becomes significant.
Welch can produce fractional df
Welch's t-test estimates each group's variance separately. Its reference degrees of freedom depend on how much each estimated variance contributes to uncertainty in the difference.
Consider a hypothetical revenue comparison with 20 independent units in group A and 100 in group B. The sample standard deviations are $20 and $5. For the absolute mean difference, the variance contributions are 20²/20 = 20 and 5²/100 = 0.25. Their sum is 20.25, giving a standard error of $4.50.
The Welch-Satterthwaite calculation is:
Here it gives approximately 19.48 df, even though there are 120 units in total. Most of the estimated uncertainty comes from the small, variable group A. Adding observations only to the already precise group B cannot remove that bottleneck.
Using 118 df because 20 + 100 - 2 = 118 would substitute the pooled method's assumptions. Rounding 19.48 up to 118 is not a harmless simplification. Let the chosen method calculate its df rather than overriding it from the total headcount.
Regression and count tables constrain different things
For ordinary least squares, residual df equal observations minus the design matrix's rank. With 100 usable observations, an intercept, and 2 nonredundant predictors, the rank is 3 and residual df are 97. Include the intercept in that count. Redundant predictor columns do not each add an independent fitted direction.
If the model fits an independent parameter for every usable observation, residual df can fall to zero. An exact fit then leaves no residual information for the usual error-variance estimate. Adding predictors until the observed data fit perfectly is not evidence that future outcomes will be predicted perfectly. A model's flexibility and its evidence for uncertainty are different things.
Ordinary one-way ANOVA illustrates another reason to read the label carefully: its F reference distribution has 2 df values. For k groups and N independent observations, the between-group and error degrees of freedom are k - 1 and N - k. A hypothetical comparison of 3 variants across 90 observations has F reference df of 2 and 87. The corrected total is 89, which equals their sum. Reporting only “df = 89” would omit the information needed to identify that F distribution. These formulas belong to the ordinary one-way model with its variance assumptions; they are not a recipe for every repeated-measures or unequal-variance ANOVA.
A chi-square test of independence uses a different structure. A 2-dimensional contingency table has (rows - 1) × (columns - 1) df. A 2-by-2 variant-by-conversion table has 1 df, whether it contains 200 users or 200,000. More traffic improves precision; it does not change the number of category relationships tested.
This is why df cannot serve as a universal substitute for sample size. Its meaning comes from the statistic and model.
Check the experimental unit before trusting a large df
Repeated events do not create independent users
Suppose you assign 1,000 users to a new experience and record 50,000 pageviews. A user-level treatment comparison does not gain 49,999 df just because the event table has that many rows. The same person's repeated events can be correlated.
Aggregate outcomes or model their dependence in a way that matches the design. A revenue-per-user metric, for example, can sum each user's eligible purchases over a fixed window before comparing groups. Explicit metric and Fact Table definitions help make that relationship between event rows and analyzed units inspectable.
Group assignment creates another case. If treatment is assigned to organizations, employees within an organization share an assignment and may influence one another. A cluster experiment needs inference that accounts for that structure. Plugging the number of employees into an ordinary independent-observation formula does not make the dependencies disappear.
Missingness changes the usable data
Check the data used for the specific metric, not only the experiment's top-line traffic count. Different metrics can have different valid windows, available measurements, or exclusions. In a paired analysis, incomplete pairs can reduce the number of usable differences.
That numerical reduction is only part of the issue. If treatment influences whether an outcome is observed, complete-case analysis can change who gets compared. A plausible df cannot tell you whether the missingness mechanism introduced bias.
Investigate a surprising value by tracing the inputs: which observations survived, what identifier defined an independent unit, what model was fitted, and whether the output uses an approximation. Treat df as a diagnostic clue rather than a quality certificate.
Also distinguish statistical df from the phrase “researcher degrees of freedom.” The latter refers to choices such as which metric, segment, exclusion, or analysis to report. Exploring those choices after seeing results can change the interpretation of evidence. It does not change the arithmetic identity n - 1 for a particular sample variance. Record the planned analysis and label exploratory follow-ups so a reader can distinguish the two issues.
Report the method behind the number
Keep df attached to the estimate and interval
A useful report names the test, the usable group sizes or pair count, the estimated effect, its standard error or interval, and the reference df when relevant. “Welch's t-test, df = 19.48” tells a reviewer more than “t-test, 120 observations.” Neither replaces an explanation of the experiment's assignment and measurement rules.
When reproducing a result, preserve the method's assumptions and software settings. A pooled t-test, a Welch test, and a model with clustered standard errors can analyze similar-looking columns while making different inferential calculations. Matching the displayed row count is not enough to reproduce the p-value.
GrowthBook's frequentist statistical calculations use a t reference distribution with degrees of freedom estimated through the Welch-Satterthwaite approximation. Its statistics overview also distinguishes frequentist and Bayesian engines. A df formula from one approach should not be inserted into the interpretation of another approach's output.
Resolve design problems before chasing precision
Before your next experiment, verify the unit of assignment and analysis, define the metric window, and choose the estimator and decision rule. Those decisions determine what information the analysis can use.
The stopping rule matters separately. A correct df does not authorize repeatedly inspecting a fixed-horizon p-value and stopping when it passes. If you need continuous decision-making, use a suitable method such as GrowthBook's frequentist sequential testing within its documented scope.
You rarely need to calculate degrees of freedom by hand in a production experiment. You do need to recognize when the reported value reflects the wrong test or the wrong independent unit. Start with the design, follow the calculation, and read the effect with its uncertainty. The df will then be an interpretable part of the result.
Build a test you can explain
Define your experiment's metrics and data source in GrowthBook, then review the treatment effect with its uncertainty and documented analysis method.
Get Started With GrowthBookChoosing where a variant runs is only the first architecture decision.
A checkout experiment can make its decision on the server, render in the browser, and measure purchases in a warehouse. Calling it “server-side” tells you little about whether the person received the assigned experience or whether their purchase joined to the right group.
Server-side testing evaluates or executes treatment logic in a backend service before returning its result. Client-side testing evaluates or applies treatment logic in the user's browser or application. Both can support randomized experiments. Both can fail through inconsistent identity, incorrect exposure events, or measurement that changes with the treatment.
The useful comparison starts with the change you want to test. A ranking algorithm belongs near the service that runs it. A browser interaction may belong in the application that renders it. Then work through the entire path from assignment to outcome, including the cache, navigation, and login transitions between them.
Separate the experiment's four locations
Assignment is different from treatment delivery
Assignment selects a variant for an eligible unit. Delivery makes the application behave according to that variant. They often happen together, but they do not have to.
For example, an edge worker can select a layout and a browser can render it. A backend can select a recommendation algorithm and return its results as JSON. A browser can select a button label without involving the server in that decision. The same statistical question can sit behind any of these implementations.
Describe the architecture with verbs: who assigns, who executes, who records exposure, and who computes the metric. That description is more useful than the label “full stack.” GrowthBook supports feature flags on the client and server, but you still choose which code consumes each flag and which system supplies the outcomes.
Exposure and analysis can live elsewhere
An exposure record should represent the experiment event your analysis is designed to use. An SDK evaluation callback tells you that an evaluation enrolled a user; it is not proof that the corresponding screen was visible or that a response reached a person.
If you evaluate a checkout flag during application startup but never use its value, the callback can precede any relevant treatment. If you log after the page finishes loading, a slower treatment can lose more events before the logger runs. Both mistakes change what the experiment population means.
Analysis has another location. With warehouse metric definitions, you can join assignment records to purchases or retention data already collected in your own data system. Running the branch on a server does not mean the server SDK has automatically captured or analyzed those outcomes.
Compare complete delivery paths
| Decision | Browser implementation | Server implementation | Hybrid implementation |
|---|---|---|---|
| Where treatment executes | Browser UI or application behavior | Backend logic, API behavior, or rendered response | Different parts execute in different runtimes |
| Main implementation dependency | Frontend code or an eligible visual change | Backend deployment and service integration | Shared identity and explicit ownership across layers |
| First-render concern | Apply the intended experience before visible replacement | Return the intended response without avoidable delays | Preserve the server result during hydration |
| Measurement concern | Blocked, delayed, or missing client events | Join server assignment to actual delivery and outcomes | Avoid duplicate or contradictory exposure records |
| Cache concern | Stale configuration or application state | Variant-specific responses shared incorrectly | Cache keys and browser state disagree |
These are engineering tradeoffs, not a universal speed ranking. A browser SDK can evaluate configuration already available locally. A server can add network waits if it fetches configuration on the request path. Measure the path you actually deploy.
Put the treatment where it can be implemented faithfully
Use the browser for changes the browser owns
Client-side testing suits interactions such as showing a different onboarding step, changing a filter interface, or selecting a message inside a web application. A developer can implement the variant directly in application code. A visual editing tool is another route for supported page changes, but client-side testing is not limited to editing the DOM after a page loads.
That distinction matters when teams compare ownership. Some changes can be authored by a growth team in a visual workflow; others require frontend engineering even though they run in the browser. The deployment and review process follows the implementation, not the statistical label.
Browser execution can create a visible replacement if the original content paints before the variant is applied. Hiding the entire page until configuration arrives can create a different problem: a long blank screen when the dependency is slow. Prefer an explicit rendering and fallback strategy over assuming every client-side test must flicker or that an anti-flicker snippet has no cost.
Use the server for backend behavior and controlled responses
Server-side testing fits a pricing calculation, search ranker, checkout service, recommendation pipeline, or response assembled before it reaches the browser. You can keep service credentials and confidential implementation details in that environment.
That benefit has a boundary. If you serialize sensitive rules, identifiers, or secrets into HTML or a browser configuration payload, their earlier evaluation on the server does not make the delivered data confidential. Review exactly what crosses the boundary.
Keep authorization independent of experimentation. A flag can select an experience for an already authorized user; it should not be the only check deciding whether that user can access a protected resource. Apply permission validation on requests regardless of the assigned variant. A client can alter browser state and requests, so browser-visible eligibility is especially unsuitable as a security boundary.
Measure performance instead of promising it
Server rendering can avoid a particular after-paint replacement, but it can also increase response time if the new branch is expensive. Client rendering can avoid a backend change while adding JavaScript work or delaying interactivity. Edge execution can shorten one network path while introducing cache and configuration-update concerns.
Compare the control and treatment on the experience people receive. Core Web Vitals distinguish loading, interaction responsiveness, and layout stability. Pair those measures with relevant backend latency and error metrics. A low flag-evaluation time does not describe the cost of the treatment, the configuration fetch, or the event pipeline.
Define fallback behavior before launch. If configuration is unavailable, decide which existing behavior remains appropriate, how the failure is observed, and whether that request belongs in the experiment analysis. Quietly mixing fallback users into an assigned treatment can dilute or distort the comparison.
Choose the smallest complete treatment
Consider 2 hypothetical checkout ideas. One changes the explanation beside a shipping option; the other changes the shipping-price calculation. The first can live in the frontend if that application already has the necessary context. The second belongs with the authoritative calculation so the displayed amount and the charged amount agree.
Combining both into one treatment may be a reasonable product decision, but it answers a broader question. If the experiment wins, you cannot attribute the change to the explanatory copy alone. Write down what differs across arms before deciding which team or runtime will implement it.
For a first integration, keep unrelated behavior identical. Use the existing purchase event and metric definition when they already represent the outcome you need. Changing rendering, pricing, identity and analytics together makes a surprising result harder to diagnose. A small experiment should still include the whole assignment-to-outcome path; small does not mean skipping instrumentation review.
Plan flags across your stack
Extend the architecture decision into ownership, lifecycle management, and production review. Use the feature flag guide to plan how flags will operate as your program grows.
Read the Feature Flag Guide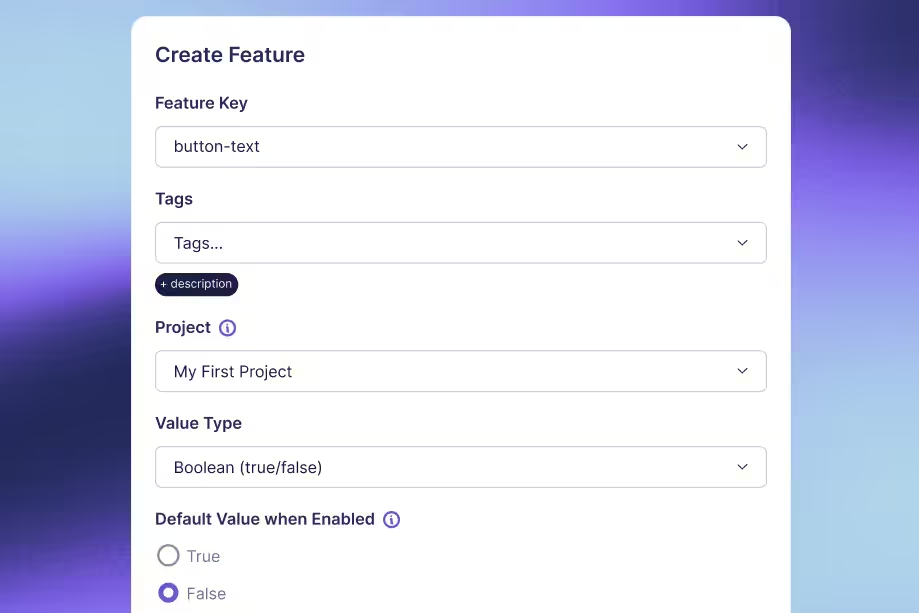
Keep identity and delivered variants consistent
Scope user attributes to the request
A shared configuration client is useful on a server. Shared mutable user attributes are a different matter. If one request replaces a global user's attributes while another request is evaluating a flag, users can receive each other's targeting context.
The current GrowthBook Node.js SDK supports a shared GrowthBookClient with a user context passed to evaluation, or a scoped instance for that context. Keep the authenticated or anonymous identifier in the request's scope. Do not use an arbitrary user-supplied identifier as authentication merely because it is convenient for experimentation.
Choose the randomization unit deliberately. A user-level experiment needs a stable user identifier; an account-level workflow may need an account identifier. Requests and pageviews are usually repeated measurements of those units, not new independent participants. Every service participating in the same treatment needs the agreed unit and identifier representation.
Treat login and configuration changes as design events
If a visitor is assigned using an anonymous identifier and switches to a different identifier after login, they can receive another variant. That is a design problem to resolve, not a reason to overwrite the old event history.
Document the identity transition, warehouse join, and intended assignment persistence. Sticky bucketing persists assignments for supported workflows; it is distinct from ordinary deterministic hashing with unchanged inputs. It does not make arbitrary identity changes or incompatible configurations equivalent.
For cross-runtime parity, verify the same experiment definition, hash attribute and its type, seed, hashing version, targeting context, and applicable rules. A string identifier and a numeric identifier should not be assumed interchangeable. Matching a few sample users is a useful diagnostic; it is not proof that every production context is equivalent.
Configuration versions also belong in the handoff. A browser tab can hold yesterday's payload while a server uses a newer one. Decide how a running experiment handles configuration refreshes and which changes require a new phase or a new experiment. Record enough metadata to diagnose disagreements without sending confidential configuration into public events.
Treat an SDK upgrade as a change to verify, too. The official JavaScript SDK changelog identifies behavior changes across versions, including attribute-type handling. Preserve your lockfile and run representative targeting and assignment checks when upgrading. A matching experiment key alone does not establish that two different SDK versions and payloads make equivalent decisions.
Make caching and hydration part of the experiment
A shared cache that keys only on URL can return the first cached variant to users assigned elsewhere. You need a cache design that preserves the intended partition without leaking personalized content between users.
Cache-Control directives distinguish private responses and storage restrictions. The Vary header describes request header fields used to select a response. Neither is a substitute for checking the actual CDN and framework cache configuration. A variant cookie does not help if the relevant cache ignores it.
With server-rendered React, the initial browser render should match the server HTML. Hydration expects matching content; changing the assigned variant on the client can create mismatches as well as a compromised treatment. Pass only the public state the browser needs, preserve the initial decision, and test navigation and login transitions separately.
Verify SDK parity before wiring production delivery
Start with a local fixture and explicit prerequisites
The following fixture compares the Node shared-client API with the GrowthBook class used in browser integrations. It runs both inside Node against synthetic configuration. It does not render a page, contact GrowthBook, send analytics, or implement production identity.
Use a currently maintained Node.js release and an empty local directory. The callback context used below requires GrowthBook SDK 1.7.0 or later; this example pins version 2.0.0. Install the package, keep the lockfile, and inspect the resolved version before continuing:
If installation fails, fix that prerequisite before running the fixture. Do not replace the SDK with a homemade hash and treat that as a check of the SDK's behavior. The browser JavaScript SDK documents the GrowthBook class, payload initialization, and tracking callback used here.
Save this as parity.mjs. The payload is an illustrative 50/50 experiment, not a production SDK connection or a CMS-created experiment:
The callback's objects are local diagnostic records defined by this example. They are not a transport contract, and putting an object in this array does not insert an exposure into your analytics system.
Run the check and interpret its limits
Use strict assertions to fail visibly when these invariants do not hold. Check syntax, then execute the file:
If the assertions pass, the script prints the PASS line. An import error means the dependency is missing or cannot be resolved. An assertion failure requires inspection of the installed SDK, payload, identifiers, and context; do not change an expected value simply to silence it.
The fixture checks equal values for these synthetic identifiers, repeatability within a scoped context, both values appearing, and identifier-shaped callback diagnostics. It does not establish a precise 50/50 sample split. It also does not prove request concurrency isolation, browser compatibility, actual rendering, or production identity correctness. Add those checks in your application's environment.
Replace the fixture boundary deliberately
For a real application, initialize configuration using the documented SDK connection and its failure-handling path. Supply identity from your application rather than the synthetic loop. Consume the selected value at the point that controls the treatment, then verify the response or UI actually follows it.
Browser integration additionally needs the application's module bundler or supported script integration, configuration readiness, and rendering lifecycle. A Node console run cannot verify those. If you use React, follow the React SDK integration rather than assuming the fixture provides a provider, hooks, or hydration handoff.
Finally, connect the documented callback or supported tracking integration to your real collection system. Map its experiment key, variation key, evaluation-time identity and timestamps to your agreed schema. Keep the mapping and retry behavior inspectable; do not copy the diagnostic array into a production event pipeline and assume attribution is complete.
Validate delivery and measurement before interpreting lift
Trace one unit through the entire path
For an isolated QA user, capture the input identifier, configuration version, selected value, delivered response, exposure record, and eventual outcome join. Repeat for both branches, a returning visitor, a login transition, and a missing-configuration fallback. Use a QA environment or isolated event sink so these checks do not create production experiment outcomes.
Test the real cache path. Make requests as different units, revisit the same unit, and inspect whether cache hits preserve the intended behavior. Test server-rendered content before JavaScript runs, after hydration, and after client-side navigation. A successful flag evaluation alongside the wrong UI is a failed experiment integration.
Include failure cases rather than only a successful page load. Delay configuration, drop the analytics request in an isolated test, and open an old tab after publishing a new QA payload. Check whether each case uses the intended fallback, keeps the correct identity, and leaves enough evidence to explain its inclusion or exclusion from analysis.
For a backend service, exercise overlapping requests from different QA users while inspecting the selected values and evaluation contexts. The sequential fixture above cannot reveal a race in your own middleware. For a browser, test a slow device and a failed script request, not just a fast development laptop. These checks target the actual ways a delivery path can diverge from its assignment record.
Write the expected failure behavior before running the checks. If an event does not arrive, the acceptable result is an observable gap with a documented handling rule, not a fabricated conversion or a silent reassignment. Keep operational recovery separate from any decision to change the experiment's analytical population.
Evaluate only where the value is relevant. GrowthBook's feature rule types distinguish targeted value delivery from an experiment rule. A percentage release is not automatically a measured A/B comparison, and a callback for a value that was never consumed does not demonstrate treatment exposure.
Reconcile collection instead of trusting one callback
Server assignment can reduce reliance on a browser for one event, but client outcomes can still be missing because of blockers, consent state, navigation, or transport failure. Server events can also fail through queues, retries, schema errors, or joins. Decide what is collected and eligible under your actual consent and measurement policy, then test that implementation symmetrically across arms.
Beacon-style analytics delivery can help with page transitions, but a successful enqueue is not proof of warehouse receipt. Reconcile callback or server logs with received events and the analyzed population. Preserve meaningful timestamps and define how duplicates are handled at the randomization unit.
Look for variant-specific loss. If treatment slows the page and its exposure is logged only after an animation completes, the retained treatment cohort can look unusually engaged. Moving assignment to the server does not repair that later selection. Record the relevant eligibility event consistently and inspect where users disappear between stages.
Consider a hypothetical collection audit with 1,000 known eligible QA units in each arm and 120 purchasers in each. Both full cohorts convert at 12%. Now suppose the exposure table retains only 900 control units and 980 treatment units, while retaining every purchaser. An analysis restricted to those recorded exposures reports 13.33% versus 12.24%. The apparent difference comes from the denominator loss, not the treatment.
In production, you cannot assume you know the missing units' outcomes as you do in this constructed example. That is why reconciliation starts with the eligibility and collection definitions, rather than repairing counts until a result looks plausible. Find the stage that lost records and assess whether the original comparison remains recoverable. More sophisticated statistics cannot restore an unidentified missing cohort.
Keep the analysis and rollback decision explicit
GrowthBook's data quality checks include sample ratio mismatch and multiple exposures. Use them alongside raw event reconciliation. Passing a traffic-split check does not prove every assigned user received the right treatment, and balanced counts do not reveal all symmetric instrumentation errors.
Before the experiment starts, record the primary metric, observation window, guardrails, sample-size or duration plan, statistical method, and decision rule. Server and client delivery do not have different laws of inference. A larger event count still does not replace independent users or accounts, and repeatedly checking a fixed-horizon result still needs an appropriate decision procedure.
If you migrate an existing experiment from browser to server delivery, document the handoff before combining results. A new identity source or exposure definition can change the analyzed population even when the product treatment appears identical. Preserve the old and new collection definitions, compare them in an isolated environment, and decide whether a separate phase or a new experiment is needed.
An A/A integration check can help uncover allocation, rendering, or telemetry differences when both arms deliver the same behavior. It does not prove the absence of bias because the result is nonsignificant. Combine that diagnostic with known QA users, raw event comparisons, and code review. Check that temporary parallel collection does not cause the same assignment or purchase to be counted twice after the handoff.
Assign an owner to the rollback path as well as the launch path. Verify which configuration change restores the intended default, how cached configuration updates, and what happens to users already assigned. After a decision, preserve the experiment record and remove obsolete branches through normal engineering review.
The architecture is ready when the unit, delivered experience, and measured outcome tell the same story. Choose the runtime that can implement the treatment faithfully, then make that full path reviewable before interpreting its lift.
Build a measurable release path
Connect your application, define the outcomes that matter, and review assignment and data quality before using an experiment result to guide a release.
Get Started With GrowthBook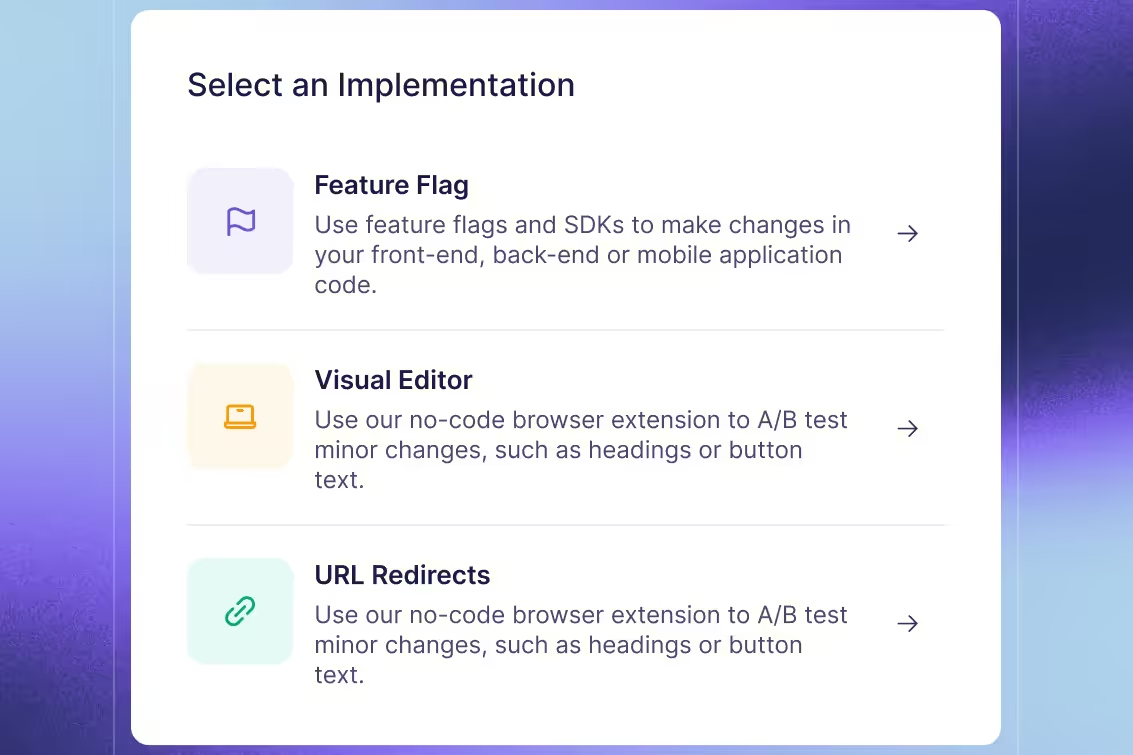
A rollout can create useful evidence even when you cannot randomize users. The comparison still has to earn a causal interpretation.
Your team introduces a new onboarding process in one market because its support team is ready first. Activation improves. That is encouraging, but the market also received a new acquisition campaign. A before-and-after chart cannot tell you how much improvement came from onboarding, the campaign, or changes that would have happened anyway.
A quasi-experiment uses a nonrandom assignment process and an explicit comparison strategy to estimate an intervention's effect. The comparison might come from another market, an eligibility cutoff, a policy rule, or a carefully modeled historical pattern. Its credibility depends on why that comparison represents what would have happened without the intervention.
This guide organizes the main designs around those opportunities. You'll learn which rollout situations support each design, what effects they can estimate, and which assumptions remain vulnerable even when a result looks statistically precise.
Identify the assignment mechanism before choosing a design
Quasi-experimental is a family of approaches
Definitions differ across fields. Some researchers use the label broadly for intervention evaluations without random allocation. Others reserve it for designs that exploit plausibly external variation in treatment. The practical question is the same: what makes the treated and comparison outcomes informative about a counterfactual?
The official guidance on quasi-experimental product evaluation describes several approaches and emphasizes the difficulty of choosing a comparison group. A label alone does not resolve that difficulty. Comparing users who voluntarily adopt a feature with users who ignore it may primarily measure motivation, need, or product familiarity.
An uncontrolled before-and-after study is especially weak when trends or other changes can explain the difference. Some taxonomies call this pre-experimental; others include it among weaker quasi-experimental designs. Describe the actual comparison instead of letting terminology imply more protection than the study provides. Design improvements for non-equivalent groups and time series help make those differences visible.
Group and time assignment can still be randomized
An experiment does not become quasi-experimental because you assign organizations instead of individual people. Randomly allocating organizations produces a cluster-randomized experiment. Randomly allocating eligible time blocks can produce a randomized switchback design, although carryover and time dependence need attention.
Conversely, assigning regions according to commercial priorities remains nonrandom even if the regions have similar population sizes. “Geographic” describes the unit, not the identification strategy.
GrowthBook's cluster experiment workflow supports group-level randomization with appropriately configured individual-level outcomes. Before accepting that randomization is impossible, investigate whether a different unit or a narrower eligible population would make it feasible. That is a design decision, not a reason to pretend account-level assignment creates independent user-level observations.
Specify the effect before opening the results
Write down the intervention, eligible population, assignment unit, start time, outcome window, and effect you need. “Did onboarding work?” is too vague. “How did offering the new onboarding process affect 28-day activation among eligible accounts in the first rollout market?” identifies a clearer target.
Distinguish an offer from actual adoption. Adoption may depend on a user's motivation, which also affects activation. Restricting the analysis to adopters after launch can destroy the comparison you intended to study.
In a randomized implementation, experiment configuration makes the assignment attribute, hypothesis, and variation setup explicit. Carry the same discipline into a quasi-experimental protocol, while recognizing that documentation does not make a nonrandom assignment rule ignorable.
Use rollout timing to construct a credible comparison
Controlled before-and-after designs compare changes
Suppose a hypothetical product rollout changes 28-day activation as follows. The outcome definition and enrollment windows are the same in both markets.
| Market | Before rollout | After rollout | Change |
|---|---|---|---|
| First rollout market | 60% | 68% | +8 percentage points |
| Comparison market | 58% | 62% | +4 percentage points |
The treated market improved by 8 points, but the comparison market improved by 4. A difference-in-differences calculation subtracts those changes: (68 - 60) - (62 - 58) = 4 percentage points.
The corresponding counterfactual for the treated market is 64%: its original 60% plus the comparison market's 4-point change. The estimated effect is 68% minus 64%. This is different from attributing the entire 8-point rise to the rollout.
The difference-in-differences identification argument requires that the groups' untreated outcomes would have followed parallel changes over the relevant period. Their baseline levels can differ. A simultaneous campaign confined to the rollout market threatens that argument because its effect enters the same 4-point estimate.
Inspect several pre-intervention periods and understand how rollout priority was chosen. A non-significant pretrend test does not prove the assumption; limited data may simply fail to reveal an important difference. Stable metric definitions and denominators are also necessary, since a new activation event or eligibility rule can manufacture an apparent change.
Staggered adoption needs explicit comparisons
When markets adopt in different months, “not treated yet” and “already treated” are different states. An already treated market can have an evolving treatment effect, making it an inappropriate stand-in for an untreated outcome.
Do not default to a single two-way fixed effects coefficient without understanding its comparisons. With heterogeneous or changing effects, it can mix effects that do not match the decision you want to make. Group-time treatment effect methods make treatment cohorts and comparison choices explicit.
For a product team, the operational task is to preserve adoption dates, eligibility, and untreated comparison periods before the rollout spreads. Once every market adopts, later effects may lack a credible untreated comparison. More post-rollout rows do not recreate that missing design element.
Interrupted time series uses the intervention date
An interrupted time series, or ITS, models the outcome trajectory before a known intervention and asks whether the subsequent level or slope departs from that trajectory. It is more informative than comparing two averages when a trend was already underway.
Consider a mandatory checkout change released everywhere on the same day. A daily series could assess an immediate discontinuity, a gradual slope change, or a delayed effect. Choose the expected pattern before searching for the most favorable model. The ITS tutorial and its updated materials address seasonality, autocorrelation, and concurrent events that complicate this analysis.
An interruption still needs a defensible counterfactual. If a holiday promotion begins on release day, an observed jump cannot distinguish the two changes without further information. An unaffected comparison series can strengthen the design when it shares relevant shocks, but a series touched by the same checkout change cannot serve that role.
Strengthen the design first
Review experiment-design mistakes, metric choices, and long-term impact in this session with Ronny Kohavi and Luke Sonnet before committing to a rollout comparison.
Explore Experiment DesignUse cutoffs and external rules without overstating their reach
Regression discontinuity identifies effects near a threshold
A regression discontinuity design, or RDD, can be useful when a pre-existing numerical rule determines eligibility. Imagine a hypothetical service offering proactive onboarding support to accounts with a risk score of at least 70. Accounts just above and below 70 may provide a useful local comparison if other determinants of activation change smoothly at the threshold.
The local cutoff identification argument does not require all high-risk and low-risk accounts to be comparable. It concerns the limit near the cutoff. The resulting effect should not automatically be generalized to accounts with scores of 20 or 95.
Check whether teams can manipulate the score or override eligibility. Also check whether the threshold triggers another intervention, such as a pricing change. If several benefits change at 70, the design may identify the effect of that bundle rather than onboarding support alone.
Implementation requires a defensible neighborhood and functional form. A raw difference between broad score bands is not the same as estimating a discontinuity. Local polynomial RD tools provide estimation, bandwidth selection, plotting, and bias-corrected inference; they cannot establish that the eligibility rule was uncompromised.
Fuzzy eligibility changes treatment probability
In a sharp design, the threshold determines treatment. In a fuzzy design, it changes the probability of treatment because some eligible accounts decline support or some ineligible accounts receive an exception.
Suppose, purely as a numerical illustration, fitted adoption probability jumps from 20% to 80% at the cutoff while fitted activation jumps from 63% to 69%. The ratio is 0.06 / 0.60 = 0.10, or 10 percentage points. Interpreting that ratio as a treatment effect requires additional instrumental-variable assumptions, including that eligibility affects activation only through the treatment and that treatment uptake moves in the required direction.
Those assumptions matter more than the attractive arithmetic. The effect concerns accounts whose treatment changes because of eligibility near the threshold. It is not automatically the effect for every account that used support.
Natural experiments need an assignment story
A natural experiment exploits an externally determined event or rule that generates useful treatment variation. The event is not necessarily a literal disaster or a sudden policy change. What matters is why its assignment is plausibly unrelated to the otherwise expected outcome, within the proposed comparison.
An instrumental-variable design can use such variation to study adoption. But an instrument must affect treatment, be suitably independent of outcome determinants, and satisfy an exclusion argument. Instrumental-variable assumptions and local effects explain why a predictor of adoption is not automatically a valid instrument.
For example, a support-team capacity rule may change whether an account receives onboarding. If that capacity also changes response times for unrelated support requests, the rule can affect activation through another path. Calling the variation external does not remove that problem. Preserve the operational records needed to examine those paths before staff assignments or exceptions are forgotten.
Construct comparison groups without hiding selection
Synthetic controls combine untreated units
When one market receives an intervention, a synthetic control can combine other markets into a weighted comparison chosen to resemble its pre-intervention trajectory and relevant predictors. It can be useful when no single market is a convincing comparison.
In a hypothetical illustration, weights of 60% and 40% on donor outcomes of 24 and 29 produce a synthetic outcome of 26. If the treated outcome is 30, the post-intervention gap is 4 outcome units. That gap becomes a causal estimate only if the donor construction and counterfactual assumptions are credible.
The feasibility requirements for synthetic controls include the availability of suitable donors and informative pre-intervention data. Donors affected by the intervention, related campaigns, or spillovers can contaminate the comparison. Good historical fit is useful evidence, but it does not guarantee that the treated market avoided a unique post-intervention shock.
Choose donors and fitting decisions without optimizing the desired post-intervention result. Compare alternative defensible donor pools and examine placebo analyses, while recognizing that a small, unusual donor set limits what those comparisons can establish.
Matching and weighting depend on measured information
Matching can align treated and comparison accounts on recorded characteristics. Weighting can reweight observations toward a specified population. These approaches may improve a non-equivalent-group design, but balance on available columns does not establish balance on unmeasured intent or readiness.
The unconfoundedness and overlap requirements are central to causal interpretations based on measured adjustment. If every enterprise account receives onboarding and no comparable enterprise account goes untreated, a model may be extrapolating rather than making a supported comparison.
Use pre-treatment variables appropriate to the causal question. Do not adjust for completed onboarding steps when those steps are part of how the intervention changes activation. That can remove part of the effect or introduce selection bias. Treat the choice of adjustment variables as a design decision, not an automatic instruction to include every warehouse field.
Let the assignment process narrow the candidates
| Available variation | Candidate design | Main question to resolve |
|---|---|---|
| Some markets change while others remain untreated | Controlled before-and-after or DiD | Would untreated outcomes have changed similarly? |
| A known date interrupts a sufficiently informative series | ITS, preferably with a suitable control series | Could another event or trend explain the interruption? |
| Eligibility changes at a numerical threshold | Sharp or fuzzy RDD | Are potential outcomes continuous and the rule unmanipulated? |
| An external rule changes treatment uptake | Natural experiment or IV | Does the rule affect the outcome through another path? |
| One treated unit has suitable unaffected donors | Synthetic control | Can the donors support a credible post-intervention counterfactual? |
If none of these arguments fits, a descriptive comparison may still be useful. Report it as descriptive rather than converting it into a causal claim through a more complicated model.
Audit threats that precise estimates can conceal
Keep population and exposure definitions stable
An activation rate can rise because activation improved or because the analyzed accounts changed. Record who was eligible at each date, who entered the data, and how incomplete outcome windows were handled. A later cohort with only 7 days of follow-up should not be compared with an earlier cohort's completed 28-day outcome.
Differential attrition creates another problem. If the intervention changes whether accounts remain observable, complete-case analysis can compare selected survivors. Similarly, filtering to users who revisit can condition on behavior caused by treatment. Count definitions and exclusions should follow the question, not the apparent direction of the result.
Also distinguish assigned availability from actual exposure. A rollout date does not mean every account encountered the new process that day. A per-protocol question about adoption needs its own assumptions; it cannot quietly replace an offer-based question after the analysis begins.
Trace spillovers, anticipation, and shared shocks
Markets can affect one another through referrals, shared sales teams, supply constraints, or users crossing boundaries. An untreated region may therefore receive part of the treatment's effect. A comparison that is administratively untreated is not necessarily causally unaffected.
People may also change behavior before the official launch because of an announcement or training. Decide whether the treatment includes that anticipation period and adjust the protocol accordingly. The date in the release calendar may be too late to define the intervention's true start.
For randomized work, GrowthBook's data quality checks surface issues such as sample ratio mismatch and multiple exposures. Those checks support an experiment's data review; they do not test the parallel trends, exclusion, or continuity assumptions of a quasi-experiment.
Match uncertainty to the source of variation
Thousands of user rows from one treated region do not create thousands of independently treated regions. Shared regional shocks and repeated measurements can make row-level standard errors misleading. The inference method needs to reflect the unit and time structure that generate the treatment comparison.
Few treated or comparison units are particularly challenging. Cluster-robust calculations, resampling, or placebo procedures have design-specific requirements; none creates independent information that was absent from the rollout. Report those limits alongside the interval instead of hiding them behind a large event count.
A falsification check should challenge a particular explanation. For example, a rollout should not change an outcome measured before any announcement or exposure. An apparent effect there can reveal a timing problem, selection, or model failure. A negative-control outcome can be useful when it shares the suspected confounding process but cannot plausibly respond to treatment. The logic of falsification testing helps distinguish that exercise from simply adding more favorable outcome charts.
Passing a check is weaker evidence than failing a well-chosen one. An unaffected outcome may not share the relevant confounder, and a placebo test may have little power. Explain why the check would reveal the threat you care about, rather than treating a collection of non-significant tests as certification.
Statistical precision also addresses a different question from identification. A narrow interval under a misspecified counterfactual can be precisely wrong. The interpretation of experiment results should keep uncertainty and data quality visible, while a quasi-experimental review must additionally evaluate the assumptions creating its comparison.
Write a protocol that can survive the rollout review
Record the causal argument before estimating the effect
A useful protocol begins with a decision: what rollout choice will this evidence inform, and what magnitude would matter? Then state the treatment version, target population, assignment mechanism, counterfactual, outcome scale, observation window, and primary analysis.
Add a threat-specific diagnostic plan. For a cutoff, inspect the assignment rule, score distribution, and other changes at the threshold. For a timed rollout, investigate pretrends, announcements, concurrent campaigns, and comparison-group exposure. Choose checks because they challenge the causal argument, not because they are easy to pass.
State what would change the conclusion. A missing historical period, an unexplained composition break, or a coincident market-specific campaign might downgrade the analysis to descriptive evidence. This makes the review useful even when the preferred causal interpretation fails.
Preserve operational evidence while the rollout is happening. Keep the original eligibility rule, announcement and deployment dates, exception log, support-capacity changes, and a record of campaigns affecting each comparison unit. Save the version of the score used for cutoff assignment rather than a later score updated after treatment. Historical outcomes alone cannot reconstruct those decisions reliably.
For the onboarding example, an audit-ready record might say: the offer began on a specified date; eligibility used account status recorded beforehand; accounts received a completed 28-day window; the comparison market retained its original process; and the concurrent campaign was either separately identified or acknowledged as unresolved. Each statement answers a concrete design question. A table containing only account IDs, a treatment flag, and activation cannot answer them all.
Report the scope and alternatives with the estimate
Share the estimate with its units, uncertainty, target population, comparison, and identifying assumptions. Separate prespecified analyses from sensitivity checks and later exploration. A result near an eligibility cutoff, an effect on treated markets, and an effect for instrument-induced adopters are different answers.
When several defensible specifications agree, explain what they share. Agreement is less reassuring if every specification assumes away the same unmeasured campaign. When results differ, show which assumption, window, or population change drives the difference rather than selecting the most favorable estimate.
Keep transport to the next rollout separate from identification of the first effect. A result for accounts near a risk threshold may not predict what happens when support is offered to everyone. Wider deployment can change staff capacity, user composition, or interactions between accounts. Even a credible local estimate may therefore support a staged follow-up rather than a universal rollout decision.
Treat that limitation as useful information for planning. Name which accounts and operational conditions the evidence covers, which extension is uncertain, and what additional comparison would reduce that uncertainty. This gives the next experiment a specific job instead of repeating the same broad question with another model.
Preserve opportunities for randomized evidence
Operational constraints may leave room for a randomized subpopulation, cluster assignment, or delayed release. A planned A/B design can sometimes answer a narrower question more credibly than a broad observational comparison. For long-term cumulative release questions, holdouts preserve a baseline across an explicitly defined feature scope.
GrowthBook's experiment decision framework helps connect randomized experiment evidence to success criteria and target precision. Its experimentation platform also supports reusable warehouse metrics and visible SQL. Those foundations help teams maintain consistent measurement; they do not turn a nonrandom rollout into a randomized study or supply a native estimator for every quasi-experimental design.
Choose the strongest comparison your assignment process can justify. Then make the limits clear enough that the next person reviewing the rollout can tell what the evidence supports and what still requires another study.
Build the randomized comparison
When your rollout allows random assignment, use GrowthBook to connect the experiment to explicit warehouse metrics and a reviewable decision process.
Get Started With GrowthBook
Ready to ship faster?
No credit card required. Start with feature flags, experimentation, and product analytics—free.